 Download Protocol PDF
Using DNA Barcodes to Identify and Classify Living Things:
Results & Discussion
I. Think About the Experimental Methods
- Describe the effect of each of the following steps or reagents used in DNA isolation (Part II or Part IIa of Experimental Methods):
- Collecting fresh or dried specimens
- Using only a small amount of tissue
- Grinding tissue with pestle
- Lysis solution
- Heating or boiling
II. Interpret Your Gel and Think About the Experiment
- Observe the photograph of the stained gel containing your PCR samples and those from other students. Orient the photograph with the sample wells at the top. Use the sample gel shown below to help interpret the band(s) in each lane of the gel.
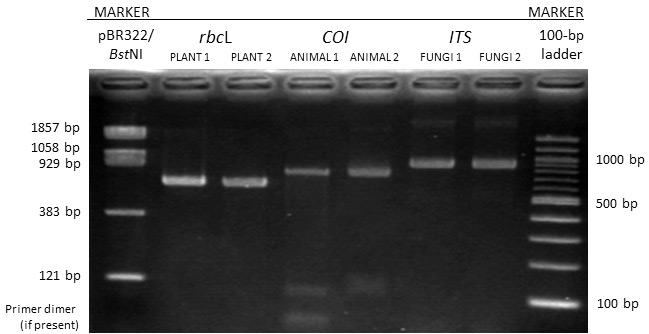
- Locate the lane containing the pBR322/BstNI markers on the left side of the gel. Working down from the well, locate the bands corresponding to each restriction fragment: 1857, 1058, 929, 383, and 121 bp. The 1058- and 929-bp fragments will be very close together or may appear as a single large band. The 121-bp band may be very faint or not visible.
- Looking across the gel at the PCR products, do the bands all appear to be the same bp size and intensity?
- It is common to see a diffuse (fuzzy) band that runs ahead of the 121-bp marker. This is "primer dimer," an artifact of the PCR that results from the primers overlapping one another and amplifying themselves.
- Which samples amplified well, and which ones did not? Give several reasons why some samples may not have amplified; some of these may be errors in procedure.
- Generally, DNA sequence can be obtained from any sample that gives an obvious band on the gel.
